- Real Gross Domestic Products of Selected OECD Countries, Table
-
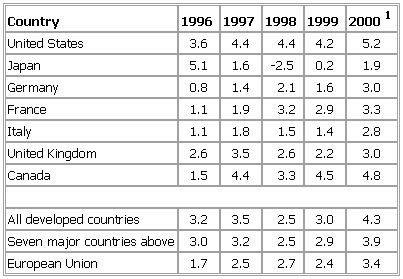
▪ 2001Products of Selected OECDCountries% annual changeUnited States 3.6 4.4 4.4 4.2 5.2Japan 5.1 1.6 -2.5 0.2 1.9Germany 0.8 1.4 2.1 1.6 3.0France 1.1 1.9 3.2 2.9 3.3Italy 1.1 1.8 1.5 1.4 2.8United Kingdom 2.6 3.5 2.6 2.2 3.0Canada 1.5 4.4 3.3 4.5 4.8All developed countries 3.2 3.5 2.5 3.0 4.3Seven major countries above 3.0 3.2 2.5 2.9 3.9European Union 1.7 2.5 2.7 2.4 3.4See as table:
 1Estimated.Note: Seasonally adjusted at annual rates.Outlook, October 2000.▪ 2000% annual changeUnited States 2.7 3.7 4.5 4.3 3.8Japan 1.5 5.1 1.4 -2.8 1.4Germany 1.7 0.8 1.5 2.2 1.3France 1.8 1.2 2.0 3.4 2.4Italy 2.9 0.9 1.5 1.3 1.0United Kingdom 2.8 2.6 3.5 2.2 1.7Canada 2.8 1.7 4.0 3.1 3.7All developed countries 2.5 3.3 3.5 2.4 2.8Seven major countries above 2.3 3.1 3.1 2.3 2.7European Union 2.4 1.6 2.5 2.7 2.1See as table:
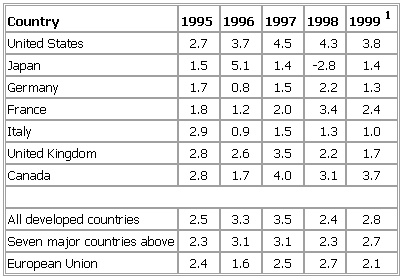 1Estimated.▪ 1999% annual changeUnited States 3.5 2.0 2.8 3.8 2.7Japan 0.6 1.5 3.9 0.9 -0.3Germany 2.7 1.8 1.4 2.2 2.7France 2.8 2.1 1.5 2.4 2.9Italy 2.2 2.9 0.7 1.5 2.4United Kingdom 4.3 2.7 2.2 3.3 1.7Canada 3.9 2.2 1.2 3.8 3.3All developed countries 2.9 2.2 2.8 3.1 2.4Seven major countries above 2.8 2.0 2.5 2.8 2.1European Union 2.9 2.5 1.7 2.6 2.7See as table:
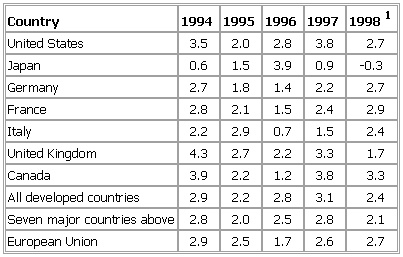 1Estimated.Source: OECD.
* * *
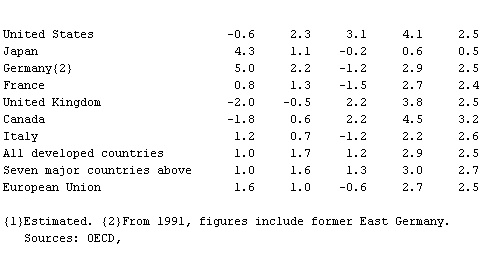
▪ Table% annual changeCountry 1991 1992 1993 1994 1995{1}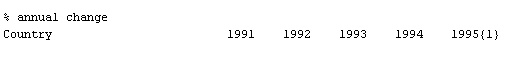 United States -0.6 2.3 3.1 4.1 2.5Japan 4.3 1.1 -0.2 0.6 0.5Germany{2} 5.0 2.2 -1.2 2.9 2.5France 0.8 1.3 -1.5 2.7 2.4United Kingdom -2.0 -0.5 2.2 3.8 2.5Canada -1.8 0.6 2.2 4.5 3.2Italy 1.2 0.7 -1.2 2.2 2.6All developed countries 1.0 1.7 1.2 2.9 2.5Seven major countries above 1.0 1.6 1.3 3.0 2.7European Union 1.6 1.0 -0.6 2.7 2.5{1}Estimated. {2}From 1991, figures include former East Germany.
* * *
Universalium. 2010.