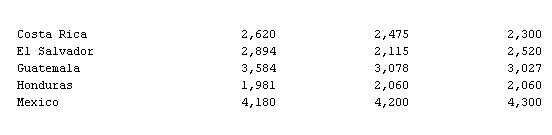
- World Green Coffee Production, Table 4
-
▪ TableIn 000 60-kg bagsRegion and country 1992-93 1993-94{1} 1994-95{2}North America 17,874 16,582 16,926Costa Rica 2,620 2,475 2,300El Salvador 2,894 2,115 2,520Guatemala 3,584 3,078 3,027Honduras 1,981 2,060 2,060Mexico 4,180 4,200 4,300
 South America 43,605 44,475 43,585 Brazil 24,000 28,500 26,000Colombia 14,950 11,400 12,500Ecuador 1,560 1,850 1,910
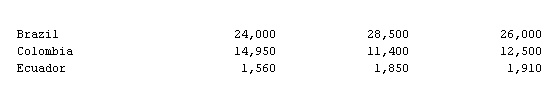 Africa 16,296 15,821 17,330 Cameroon 837 1,250 1,300Côte d'Ivoire 2,500 2,700 3,400Ethiopia 2,800 3,000 3,500Kenya 1,217 1,230 1,330Uganda 2,800 2,700 3,000Zaire 1,790 1,100 1,300
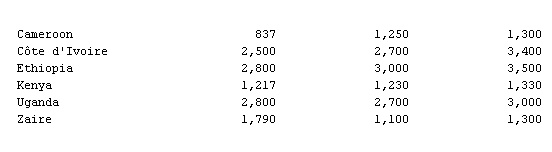 Asia and Oceania 15,630 1,660 16,465 India 2,700 3,450 3,000Indonesia 7,350 7,400 7,000Vietnam 2,250 2,500 3,100Total production 93,405 93,538 94,306Exportable{3} 72,471 70,019 72,061Beginning stocks{4} 47,391 42,570 35,534Exports 77,668 77,609 77,297{1}Preliminary.{2}Forecast.{3}Production minus domestic use.{4}In exporting countries.
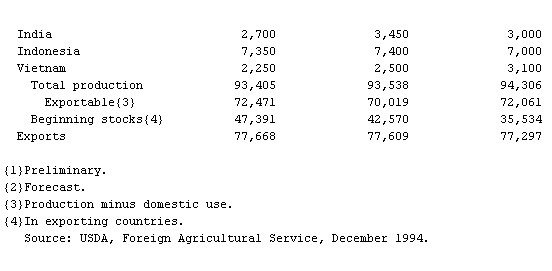
* * *
Universalium. 2010.