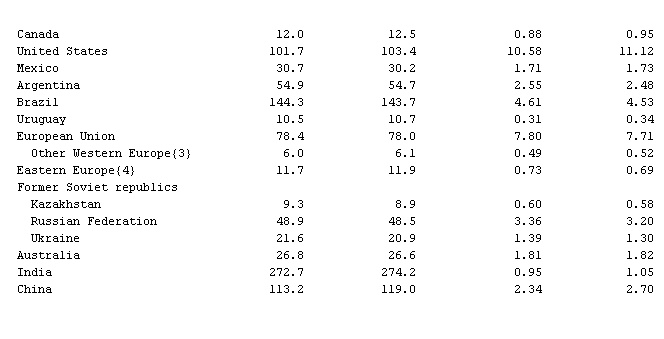
- Livestock Inventories and Meat Production in Major Producing Countries, Table 2
-
▪ TableIn 000,000 head and 000,000 metric tons (carcass weight)Region and country 1993{1} 1994{2} 1993{1} 1994{2}Cattle and buffalo Beef and vealWorld total 1,034.3 1,039.0 44.18 44.75Canada 12.0 12.5 0.88 0.95United States 101.7 103.4 10.58 11.12Mexico 30.7 30.2 1.71 1.73Argentina 54.9 54.7 2.55 2.48Brazil 144.3 143.7 4.61 4.53Uruguay 10.5 10.7 0.31 0.34European Union 78.4 78.0 7.80 7.71Other Western Europe{3} 6.0 6.1 0.49 0.52Eastern Europe{4} 11.7 11.9 0.73 0.69Former Soviet republicsKazakhstan 9.3 8.9 0.60 0.58Russian Federation 48.9 48.5 3.36 3.20Ukraine 21.6 20.9 1.39 1.30Australia 26.8 26.6 1.81 1.82India 272.7 274.2 0.95 1.05China 113.2 119.0 2.34 2.70
 Hogs Pork World total 741.5 750.5 66.08 67.30Canada 11.2 11.7 1.19 1.25United States 57.9 60.5 7.75 7.93Mexico 12.1 12.4 0.87 0.92European Union 110.2 109.8 14.64 14.63Other Western Europe{3} 7.9 7.7 0.99 0.98Eastern Europe{5} 34.4 35.5 2.71 2.28Former Soviet republicsKazakhstan 2.4 2.2 0.24 0.22Russian Federation 28.6 26.0 2.43 2.30Ukraine 15.3 14.4 1.04 0.95Japan 10.6 10.5 1.43 1.41China 393.0 401.0 28.54 30.00
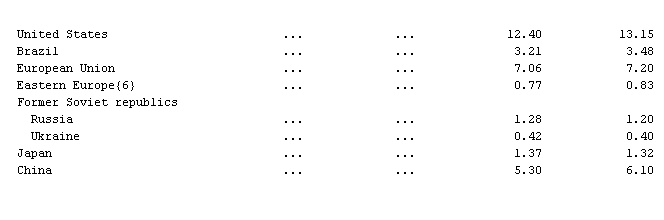
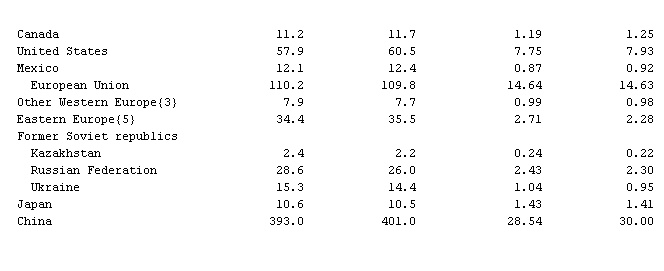 Poultry Poultry meat{6} World total ... ... 39.32 41.56United States ... ... 12.40 13.15Brazil ... ... 3.21 3.48European Union ... ... 7.06 7.20Eastern Europe{6} ... ... 0.77 0.83Former Soviet republicsRussia ... ... 1.28 1.20Ukraine ... ... 0.42 0.40Japan ... ... 1.37 1.32China ... ... 5.30 6.10World total{7} 896.0 889.1 6.30 6.28All meatTotal ... ... 155.88 159.88{1}Preliminary livestock numbers at year's end. Countries included in totals but not showninclude the most significant for trade in Latin America, Asia, and scattered coverageelsewhere.{2}Forecast.{3}Austria, Sweden, and Switzerland.{4}Bulgaria, Poland, and Romania.{5}Bulgaria, Hungary, Poland, and Romania.{6}Ready-to-eat equivalent.{7}Hungary, Poland, and Romania.{8}Coverage includes China.
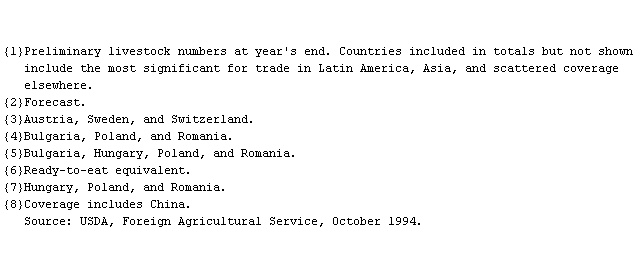
* * *
Universalium. 2010.