- Ta ble IV. Index Numbers of Production, Employment, and Productivity in Manufacturing Industries
-
▪ TableTable IV. Index Numbers of Production, Employment, and Productivity in Manufacturing Industries1990 = 100Area 1994 1995 1994 1995 1994 1995World2 104 107 . . . . . . . . . . . .Industrial countries 101 104 . . . . . . . . . . . .Less-industrializedcountries 118 122 . . . . . . . . . . . .North America3 115 120 . . . . . . . . . . . .Canada 106 110 . . . 89 . . . 123United States 113 117 96 97 118 121Latin America4 111 112 . . . . . . . . . . . .Brazil 109 111 . . . . . . . . . . . .Mexico 110 103 . . . . . . . . . . . .Asia5 105 111 . . . . . . . . . . . .India 113 131 . . . . . . . . . . . .Japan 92 95 103 100 90 95South Korea 134 151 97 98 138 153Europe6 94 95 . . . . . . . . . . . .Austria 104 111 86 . . . 121 . . .Belgium 100 104 . . . . . . . . . . . .Denmark 111 116 . . . . . . . . . . . .Finland 108 117 76 81 142 144France 99 101 . . . . . . . . . . . .Germany(1991=100) 94 95 . . . . . . . . . . . .Greece 96 98 . . . . . . . . . . . .Ireland 135 162 104 110 130 147Netherlands 101 104 . . . . . . . . . . . .Norway 109 111 . . . . . . . . . . . .Portugal 93 96 . . . . . . . . . . . .Sweden 105 115 . . . . . . . . . . . .Switzerland 107 113 . . . . . . . . . . . .United Kingdom 99 102 . . . . . . . . . . . .Rest of the world7 . . . . . . . . . . . . . . . . . .Oceania 114 118 . . . . . . . . . . . .South Africa 96 103 96 97 100 106See as table:
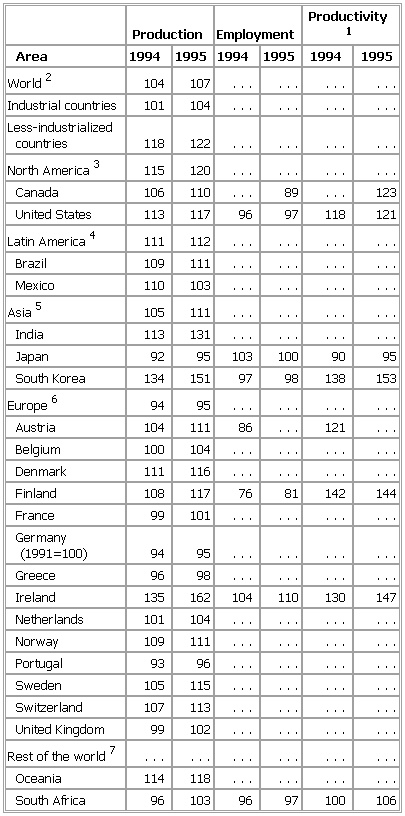 1This is 100 times the production index divided by the employment index, giving a roughindication of changes in output per person employed.2Excluding Albania, China, North Korea, Vietnam, former Czechoslovakia, former SovietUnion, and former Yugoslavia.3Canada and the United States.4South and Central America (including Mexico) and the Caribbean islands.5Asian Middle East and East and Southeast Asia, including Japan, Israel, and Turkey.6Excluding Albania, former Czechoslovakia, former Yugoslavia, and European countriesof the former Soviet Union.7Africa and Oceania.Sources: UN, Monthly Bulletin of Statistics; ILO,Yearbook of Labour Statistics.
* * *
Universalium. 2010.