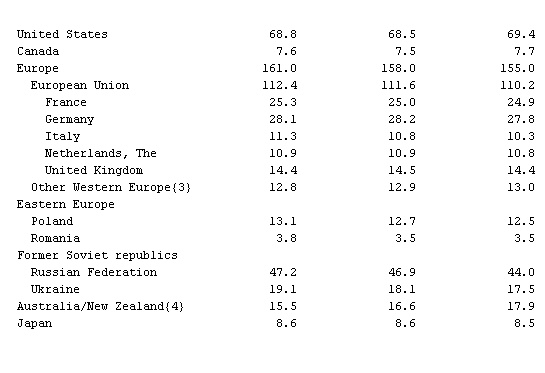
World Production of Milk, Table 2
- World Production of Milk, Table 2
-
In 000,000 metric tons
Region and country 1992 1993{1} 1994{2}
Developed countries 354.0 348.0 342.0
United States 68.8 68.5 69.4
Canada 7.6 7.5 7.7
Europe 161.0 158.0 155.0
European Union 112.4 111.6 110.2
France 25.3 25.0 24.9
Germany 28.1 28.2 27.8
Italy 11.3 10.8 10.3
Netherlands, The 10.9 10.9 10.8
United Kingdom 14.4 14.5 14.4
Other Western Europe{3} 12.8 12.9 13.0
Eastern Europe
Poland 13.1 12.7 12.5
Romania 3.8 3.5 3.5
Former Soviet republics
Russian Federation 47.2 46.9 44.0
Ukraine 19.1 18.1 17.5
Australia/New Zealand{4} 15.5 16.6 17.9
Japan 8.6 8.6 8.5
 Less developed countries 172.0 177.0 181.0
 Latin America 44.0 45.0 46.0
Brazil 15.0 15.2 15.3
Africa 12.0 12.0 12.0
Asia 116.0 119.0 123.0
China 5.0 5.1 5.3
India 29.4 30.5 30.5
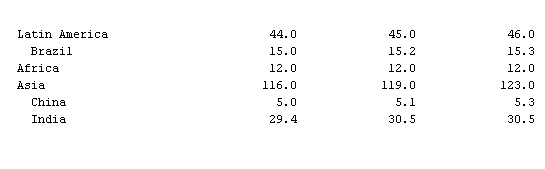 World total 526.0 525.0 526.0
 {1}Preliminary.
{2}Forecast.
{3}Austria, Finland, Sweden, and Switzerland.
{4}Year ending June 30 for Australia and May 31 for New Zealand.
Sources:
FAO,
 Food Outlook,
 November/December 1994; USDA, Foreign Agricultural
Service, August 1994.
* * *
Universalium.
2010.
Look at other dictionaries:
World Production of Milk, Table 1 — ▪ Table Table VI. World Production of Milk1 In 000,000 metric tons Region and country 1995 19962 19973 Developed countries 342 336 338 United States 70 70 71 Canada 8 8 8 Europe 160 159 160 European Union 125 125 124 France… … Universalium
World Production of Milk, Table — ▪ 1999 Table VI. World Production of Milk1 In 000,000 metric tons Region and country 1996 19972 19983 Developed countries 341 338 337 United States 70 72 71 Canada 8 8 8 Western Europe 131 129 130 European Union 125… … Universalium
World Production of Milk1, Table — ▪ Table Table VI. World Production of Milk1 In 000,000 metric tons Region and country 1994 19952 19963 Developed countries 349 347 347 United States 70 71 70 Canada 8 8 … … Universalium
World Production of Dairy Products, Table — ▪ Table Production of cow s milk In 000,000 metric tons Region and country 1991 1992{1} 1993{2} Developed countries 362.2 347.1 337.8 United States 67.3 68.8 68.6 Canada 7.8 7.4 7.4 Western Europe 128.8 126.3 125.4 European Community 113.9 111.6… … Universalium
Milk — For other uses, see Milk (disambiguation). Foremilk and Hindmilk samples of human breast milk … Wikipedia
Production history of the Oregon Shakespeare Festival — Production history of plays performed by the Oregon Shakespeare Festival (1935–present). Contents 1 The early years 2 The post war years 3 The 1960s 4 The 1970s … Wikipedia
Agriculture and Food Supplies — ▪ 2007 Introduction Bird flu reached Europe and Africa, and concerns over BSE continued to disrupt trade in beef. An international vault for seeds was under construction on an Arctic island. Stocks of important food fish species were reported… … Universalium
Tea production in Sri Lanka — Main articles: Economy of Sri Lanka and Sri Lanka Tea plantation in the Sri Lankan central highlands … Wikipedia
When the World Comes Down — Studio album by The All American Rejects Released December 16 … Wikipedia
Environmental effects of meat production — This article discusses the environmental effects of livestock and poultry farming. For the environmental effects of fishing, see Environmental effects of fishing. Environmental effects of meat production include pollution and the use of resources … Wikipedia