Changes in Output in Less Developed Countries, Table
- Changes in Output in Less Developed Countries, Table
-
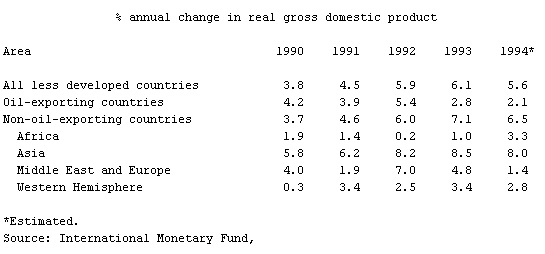
% annual change in real gross domestic product
Area 1990 1991 1992 1993 1994*
All less developed countries 3.8 4.5 5.9 6.1 5.6
Oil-exporting countries 4.2 3.9 5.4 2.8 2.1
Non-oil-exporting countries 3.7 4.6 6.0 7.1 6.5
Africa 1.9 1.4 0.2 1.0 3.3
Asia 5.8 6.2 8.2 8.5 8.0
Middle East and Europe 4.0 1.9 7.0 4.8 1.4
Western Hemisphere 0.3 3.4 2.5 3.4 2.8
*Estimated.
* * *
Universalium.
2010.
Look at other dictionaries:
Changes in Output in Less-Developed Countries, Table 1 — ▪ Table Table IV. Changes in Output in Less Developed Countries % annual change in real gross domestic product Area 1992 1993 1994 1995 19961 All less developed countries 6.4 6.3 6.6 5.9 6.3 Africa 0.8 0.9 2.9 3.0 5.0 … … Universalium
Changes in Output in Less-Developed Countries, Table — ▪ 2001 Table III. Changes in Output in Less Developed Countries % annual change in real gross domestic product Area 1996 1997 1998 1999 20001 All less developed countries 6.5 5.7 3.5 3.8 5.6 Regional groups Africa 5.7 2.8 3.1 2.2 3.4 … … Universalium
Changes in Output in Less-Developed Countries 3 — ▪ Table Changes in Output in Less Developed Countries % annual change in real gross domestic product Area 1997 1998 1999 2000 20011 All less developed countries 5.8 3.5 3.9 5.8 4.3 Regional groups Africa 3.1 3.3 2.5 2.8 3.8 Asia 6.5 4 … Universalium
Changes in Output in Less-Developed Countries — ▪ Table Changes in Output in Less Developed Countries % annual change in real gross domestic product Area 2000 2001 2002 2003 20041 All less developed countries 5.9 4.0 4.8 6.1 6.6 Regional groups Africa 2.9 4.0 3.5 4.3 4.5 Asia 6.7 5.5 6.6 7.7 7 … Universalium
Changes in Output in Less-Developed Countries 1 — ▪ Table Changes in Output in Less Developed Countries % annual change in real gross domestic product Area 2001 2002 2003 2004 20051 All less developed countries 4.1 4.8 6.5 7.3 6.40 Regional groups Africa 4.1 3.6 4.6 5.3 4.50 Asia 5.6 6.6 8.1 8.2 … Universalium
Changes in Output in Less-Developed Countries 2 — ▪ Table % annual change in real gross domestic product Area 1999 2000 2001 2002 20031 All less developed countries 3.9 5.7 4.1 4.6 5.0 Regional groups Africa 2.7 3.0 3.7 3.1 3.7 Asia 6.2 6.8 5.8 6.4 6.4 Middle East, Europe, Malta,… … Universalium
Changes in Output in Less-Developed Countries 4 — ▪ Table % annual change in real gross domestic product Area 1998 1999 2000 2001 20021 All less developed countries 3.5 4.0 5.7 3.9 4.2 Regional groups Africa 3.4 2.8 3.0 3.5 3.1 Asia 4.0 6.1 6.7 5.6 6.1 Middle East, Europe, Malta,… … Universalium
Changes in Output in the Less Developed Countries, Table — ▪ Table % annual change in real gross domestic product Area 1989 1990 1991 1992 1993* All less developed countries 4.1 3.7 4.5 5.8 6.1 Oil exporting countries 5.0 4.1 4.1 5.9 2.9 Non oil exporting countries 3.8 3.6 4.6 5.7 7.0 Africa 3.6 1.9 1.6… … Universalium
Index Numbers of Production, Employment, and Productivity in Manufacturing Industries, Table 2 — ▪ Table Table IV. Index Numbers of Production, Employment, and Productivity1 in Manufacturing Industries 1990 = 100 Production Employment Productivity Area 1995 1996 1995 1996 1995 1996 World2 110 113 . . . . . . . . . . . . Developed… … Universalium
Economic Affairs — ▪ 2006 Introduction In 2005 rising U.S. deficits, tight monetary policies, and higher oil prices triggered by hurricane damage in the Gulf of Mexico were moderating influences on the world economy and on U.S. stock markets, but some other… … Universalium