Index Numbers of Production, Employment, and Productivity in Manufacturing Industries, Table 1

Index Numbers of Production, Employment, and Productivity in Manufacturing Industries, Table 1

Table
1980 = 100

Relative
importance{1} Production Employment Productivity{2}
Area 1980 1993 1992 1993 1992 1993 1992 1993

World{3} 1,000 1,000 126 126 ... ... ... ...
Industrial countries 861 812 120 119 ... ... ... ...
Less industrialized
countries 139 188 164 174 ... ... ... ...
North America{4} 282 303 130 136 ... ... ... ...
Canada 22 21 115 120 ... ... ... ...
United States 260 283 139 142 90 89 154 164
Latin America{5} 79 75 114 120 ... ... ... ...
Brazil 26 21 93 103 ... ... ... ...
Mexico 18 ... 130 ... ... ... ... ...
Asia{6} 183 252 172 173 ... ... ... ...
India 11 ... 210 ... ... ... ... ...
Japan 131 140 141 135 122 121 116 112
South Korea 6 18 360 380 ... ... ... ...
Europe{7} 422 350 108 104 ... ... ... ...
Austria 9 9 135 131 78 ... 173 ...
Belgium 13 12 122 118 ... ... ... ...
Denmark 5 5 138 134 97 93 142 144
Finland 6 6 121 127 71 66 170 192
France 75 62 108 104 ... ... ... ...
Former West
Germany 114 105 125 116 ... ... ... ...
Greece 4 3 100 97 ... ... ... ...
Ireland 2 4 222 234 84 ... 264 ...
Netherlands, The 14 14 128 125 ... ... ... ...
Norway 5 4 111 113 ... ... ... ...
Portugal 3 3 142 135 ... ... ... ...
Sweden 13 12 110 113 ... ... ... ...
Switzerland 13 13 123 122 ... ... ... ...
United Kingdom 58 54 116 117 ... ... ... ...
Rest of the world{8} 34 ... ... ... ... ... ... ...
Oceania 15 13 111 113 ... ... ... ...
South Africa 8 6 98 98 ... ... ... ...

{1}The 1980 weights are those applied by the UN Statistical Office.
{2}This is 100 times the production index divided by the employment index, giving a rough
indication of changes in output per person employed.
{3}Excluding Albania, China, North Korea, Vietnam, former Czechoslovakia, former Soviet
Union, and former Yugoslavia.
{4}Canada and the United States.
{5}South and Central America (including Mexico) and the Caribbean islands.
{6}Asian Middle East and East and Southeast Asia, including Japan, Israel, and Turkey.
{7}Excluding Albania, former Czechoslovakia, former Yugoslavia, and European countries
of the former Soviet Union.
{8}Africa and Oceania.
Source: UN, 
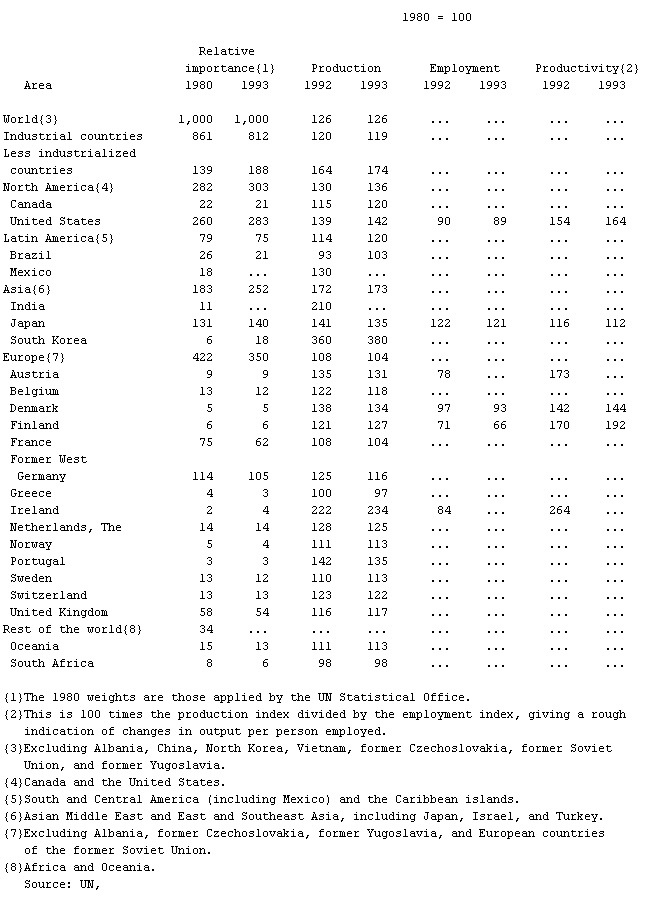
Monthly Bulletin of Statistics.

* * *


Universalium. 2010.

Игры ⚽ Нужна курсовая?

Look at other dictionaries:

  • Index Numbers of Production, Employment, and Productivity in Manufacturing Industries, Table 2 — ▪ Table Table IV. Index Numbers of Production, Employment, and Productivity1 in Manufacturing Industries 1990 = 100     Production Employment Productivity   Area 1995 1996 1995 1996 1995 1996 World2 110 113 . . . . . . . . . . . . Developed… …   Universalium

  • Index Numbers of Production, Employment, and Productivity in Manufacturing Industries, Table — ▪ 1999 Table IV. Index Numbers of Production, Employment, and Productivity1 in Manufacturing Industries 1990 = 100   Production Employment Productivity   Area 1996 1997 1996 1997 1996 1997 World2 113 120 . . . . . . . . . . . . Developed… …   Universalium

  • Ta ble IV. Index Numbers of Production, Employment, and Productivity in Manufacturing Industries — ▪ Table Table IV. Index Numbers of Production, Employment, and Productivity in Manufacturing Industries                                                         1990 = 100   Production Employment Productivity1   Area  1994  1995 1994  1995 1994 … …   Universalium

  • Index Numbers of Production, Employment, and Productivity in Manufacturing Industries, Table 3 — ▪ Table 1980 = 100 Relative importance{1} Production Employment Productivity{2} Area 1980 1994 1993 1994 1993 1994 1993 1994 World{3} 1,000 1,000 125 131 ... ... ... ... Industrial countries 861 812 118 123 ... ... ... ... Less industrialized… …   Universalium

  • Business and Industry Review — ▪ 1999 Introduction Overview        Annual Average Rates of Growth of Manufacturing Output, 1980 97, Table Pattern of Output, 1994 97, Table Index Numbers of Production, Employment, and Productivity in Manufacturing Industries, Table (For Annual… …   Universalium

  • Industrial Review — ▪ 1994 Introduction       The period since 1990 was proving a difficult time for the older industrialized economies, which had suffered from prolonged recession at home, and also for the previously centrally planned economies of Eastern Europe… …   Universalium

  • Productivity — in economics refers to measures of output from production processes, per unit of input. Labor productivity, for example, is typically measured as a ratio of output per labor hour, an input. Productivity may be conceived of as a measure of the… …   Wikipedia

  • productivity — pro·duc·tiv·i·ty (prō dŭk tĭvʹĭ tē, prŏd ək ) n. 1. The quality of being productive. 2. Economics. The rate at which goods or services are produced especially output per unit of labor. 3. Ecology. The rate at which radiant energy is used by… …   Universalium

  • HISTORICAL SURVEY: THE STATE AND ITS ANTECEDENTS (1880–2006) — Introduction It took the new Jewish nation about 70 years to emerge as the State of Israel. The immediate stimulus that initiated the modern return to Zion was the disappointment, in the last quarter of the 19th century, of the expectation that… …   Encyclopedia of Judaism

  • Comparison of Canadian and American economies — The economies of Canada and the United States are extremely similar because they are both developed countries and are each other s largest trading partners. However, key differences in population makeup, geography, government policies and… …   Wikipedia

Share the article and excerpts

Direct link
Do a right-click on the link above
and select “Copy Link”