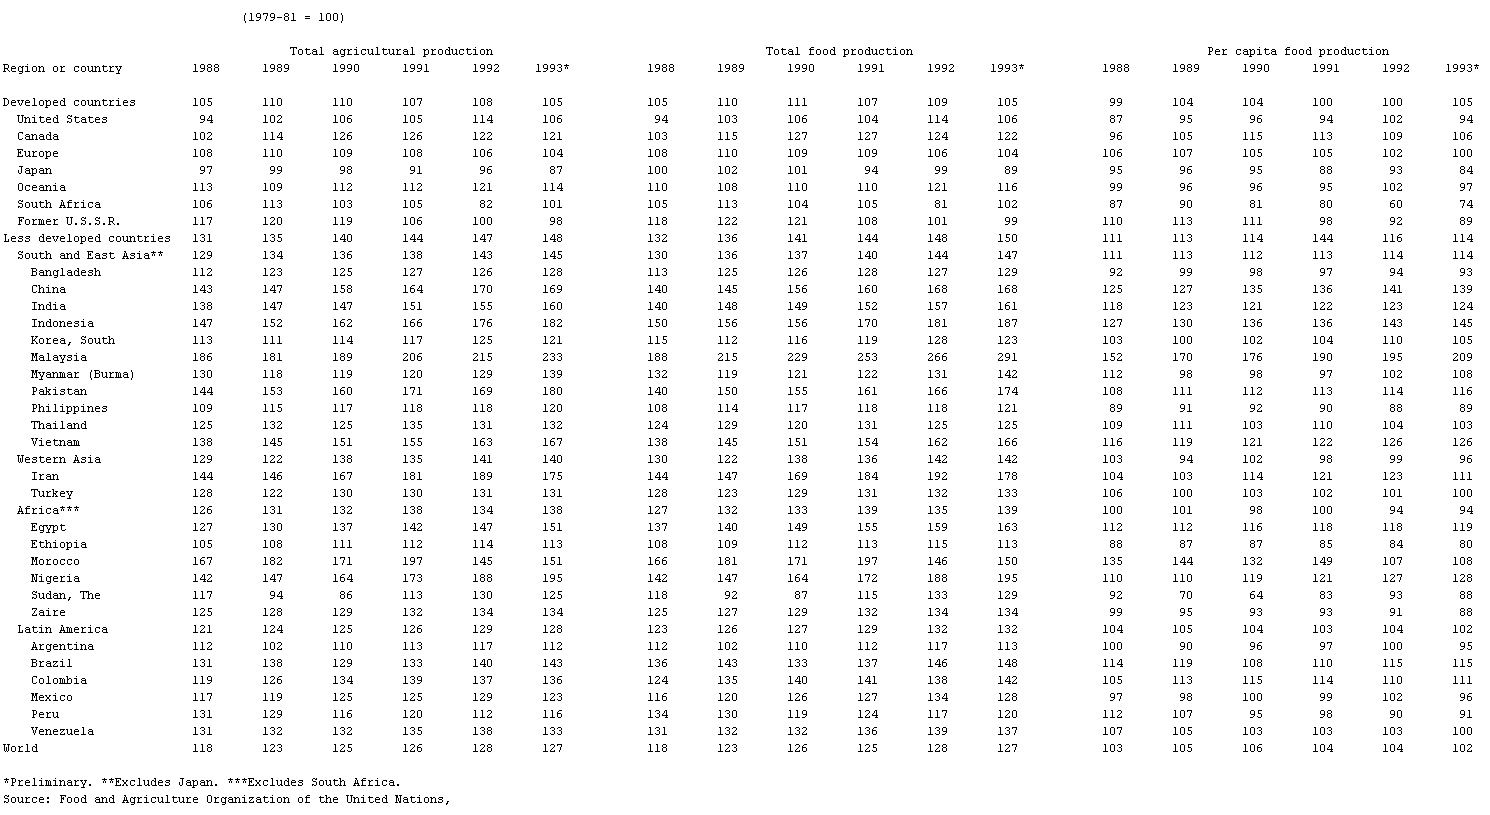
- Selected Indexes of World Agricultural and Food Production, Table 1
-
▪ Table(1979-81 = 100)Total agricultural production Total food production Per capita food productionRegion or country 1988 1989 1990 1991 1992 1993* 1988 1989 1990 1991 1992 1993* 1988 1989 1990 1991 1992 1993*Developed countries 105 110 110 107 108 105 105 110 111 107 109 105 99 104 104 100 100 105United States 94 102 106 105 114 106 94 103 106 104 114 106 87 95 96 94 102 94Canada 102 114 126 126 122 121 103 115 127 127 124 122 96 105 115 113 109 106Europe 108 110 109 108 106 104 108 110 109 109 106 104 106 107 105 105 102 100Japan 97 99 98 91 96 87 100 102 101 94 99 89 95 96 95 88 93 84Oceania 113 109 112 112 121 114 110 108 110 110 121 116 99 96 96 95 102 97South Africa 106 113 103 105 82 101 105 113 104 105 81 102 87 90 81 80 60 74Former U.S.S.R. 117 120 119 106 100 98 118 122 121 108 101 99 110 113 111 98 92 89Less developed countries 131 135 140 144 147 148 132 136 141 144 148 150 111 113 114 144 116 114South and East Asia** 129 134 136 138 143 145 130 136 137 140 144 147 111 113 112 113 114 114Bangladesh 112 123 125 127 126 128 113 125 126 128 127 129 92 99 98 97 94 93China 143 147 158 164 170 169 140 145 156 160 168 168 125 127 135 136 141 139India 138 147 147 151 155 160 140 148 149 152 157 161 118 123 121 122 123 124Indonesia 147 152 162 166 176 182 150 156 156 170 181 187 127 130 136 136 143 145Korea, South 113 111 114 117 125 121 115 112 116 119 128 123 103 100 102 104 110 105Malaysia 186 181 189 206 215 233 188 215 229 253 266 291 152 170 176 190 195 209Myanmar (Burma) 130 118 119 120 129 139 132 119 121 122 131 142 112 98 98 97 102 108Pakistan 144 153 160 171 169 180 140 150 155 161 166 174 108 111 112 113 114 116Philippines 109 115 117 118 118 120 108 114 117 118 118 121 89 91 92 90 88 89Thailand 125 132 125 135 131 132 124 129 120 131 125 125 109 111 103 110 104 103Vietnam 138 145 151 155 163 167 138 145 151 154 162 166 116 119 121 122 126 126Western Asia 129 122 138 135 141 140 130 122 138 136 142 142 103 94 102 98 99 96Iran 144 146 167 181 189 175 144 147 169 184 192 178 104 103 114 121 123 111Turkey 128 122 130 130 131 131 128 123 129 131 132 133 106 100 103 102 101 100Africa*** 126 131 132 138 134 138 127 132 133 139 135 139 100 101 98 100 94 94Egypt 127 130 137 142 147 151 137 140 149 155 159 163 112 112 116 118 118 119Ethiopia 105 108 111 112 114 113 108 109 112 113 115 113 88 87 87 85 84 80Morocco 167 182 171 197 145 151 166 181 171 197 146 150 135 144 132 149 107 108Nigeria 142 147 164 173 188 195 142 147 164 172 188 195 110 110 119 121 127 128Sudan, The 117 94 86 113 130 125 118 92 87 115 133 129 92 70 64 83 93 88Zaire 125 128 129 132 134 134 125 127 129 132 134 134 99 95 93 93 91 88Latin America 121 124 125 126 129 128 123 126 127 129 132 132 104 105 104 103 104 102Argentina 112 102 110 113 117 112 112 102 110 112 117 113 100 90 96 97 100 95Brazil 131 138 129 133 140 143 136 143 133 137 146 148 114 119 108 110 115 115Colombia 119 126 134 139 137 136 124 135 140 141 138 142 105 113 115 114 110 111Mexico 117 119 125 125 129 123 116 120 126 127 134 128 97 98 100 99 102 96Peru 131 129 116 120 112 116 134 130 119 124 117 120 112 107 95 98 90 91Venezuela 131 132 132 135 138 133 131 132 132 136 139 137 107 105 103 103 103 100World 118 123 125 126 128 127 118 123 126 125 128 127 103 105 106 104 104 102*Preliminary. **Excludes Japan. ***Excludes South Africa.Source: Food and Agriculture Organization of the United Nations,
 FAO Quarterly Bulletin of Statistics.
 * * *
Universalium. 2010.