Selected Major World Stock Market Indexes1, Table

Selected Major World Stock Market Indexes1, Table

Table
Table VI. Selected Major World Stock Market Indexes1
            Percent
  1996 range2  Year-end   change from 
Country and Index High  Low  close     12/31/95    
Australia, Sydney All Ordinaries 2425 2096 2425     10         
Austria, Credit Aktien 395 349 382     11         
Belgium, Brussels BEL20 1897 1575 1895     22         
Canada, Toronto Composite 6019 4740 5927     26         
Denmark, Copenhagen Stock 
  Exchange  472  368 472     29         
Finland, HEX General 2496 1652 2496     46         
France, Paris CAC 40 2349 1898 2316     24         
Germany, Frankfurt FAZ Aktien 1006 819 992     22         
Hong Kong, Hang Seng 13,531 10,205 13,451     34         
Ireland, ISEQ Overall 2726 2235 2726     22         
Italy, Milan Banca Comm. Ital. 674 572 666     13         
Japan, Nikkei Average 22,667 19,162 19,361     -3         
Mexico, IPC 3434 2736 3347     20         
Netherlands, The, CBS All Share 437 432 437     36         
Norway, Oslo Stock Exchange 1644 1260 1644     30         
Philippines, Manila Composite 3374 2579 3171     22         
Singapore, SES All-Singapore 610 504 536     -3         
South Africa, Johannesburg        
  Industrials 8739 7569 7922     -1         
Spain, Madrid Stock Exchange 445 324 445     39         
Sweden, Affarsvarlden General 2403 1707 2403     38         
Switzerland, SBC General 1323 1114 1321     17         
Taiwan, Weighted Price 6983 4690 6934     34         
Thailand, Bangkok SET 1415 817 832     -35         
Turkey, Istanbul Composite 97,589 38,779 97,589     144         
United Kingdom, FT-SE 100 4119 3632 4119     12         
United States, Dow Jones Industrials 6561 5033 6448     26         
World, MS Capital International 837 726 826     33         
See as table:

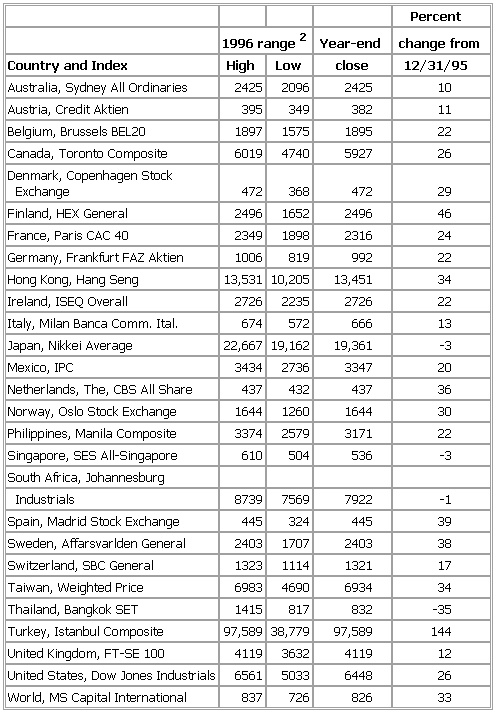
      1Index numbers are rounded.  2Based on daily closing price.
  Source: Financial Times.

* * *


Universalium. 2010.

Игры ⚽ Поможем написать курсовую

Look at other dictionaries:

  • Selected Major World Stock Market Indexes, Table 1 — ▪ Table Table VI. Selected Major World Stock Market Indexes1   Country and index 1997 range2  High      Low Year end  close Percent  change from  12/31/96 Australia, Sydney All Ordinaries 2779 2299    2617   8 Austria, Credit Aktien 474 374     … …   Universalium

  • Selected Major World Stock Market Indexes, Table — ▪ 2001 Table V. Selected Major World Stock Market Indexes1 Country and index   2000 range2 High      Low  Year end close  Percent  change from 12/31/99 Australia, Sydney All Ordinaries 3330 2920    3155     0 Belgium, Brussels BEL20 3311 2532   … …   Universalium

  • Selected Major World Stock Market Indexes — ▪ Table Selected Major World Stock Market Indexes1 2004 range2 Year end Percent change from Country and Index High Low close 12/31/2003 Argentina, Merval 1390 840 1375 28 Australia, Sydney All Ordinaries 4057 3275 4053 23 Belgium, Brussels BEL20… …   Universalium

  • Selected Major World Stock Market Indexes 1 — ▪ Table Selected Major World Stock Market Indexes1 2005 range2 Year end Percent change from Country and Index High Low close 12/31/2004 Argentina, Merval 1731 1276 1543 12 Australia, Sydney All Ordinaries 4715 3905 4709 16 Belgium, Brussels BEL20 …   Universalium

  • Selected Major World Stock Market Indexes 2 — ▪ Table Selected Major World Stock Market Indexes1 Country and Index 2006 range2  High              Low Year end close Percent change from 12/31/2005 Argentina, Merval 2090 1497 2090 35 Australia, Sydney All Ordinaries 5644 4721 5644 20 Brazil,… …   Universalium

  • Selected Major World Stock Market Indexes 3 — ▪ Table Selected Major World Stock Market Indexes1 Country and Index 2007 range2  High              Low Year end close Percent change from 12/31/2006 Argentina, Merval 2351 1834 2152 3 Australia, Sydney All Ordinaries 6873 5482 6421 14 Brazil,… …   Universalium

  • Selected Major World Stock Market Indexes 4 — ▪ Table Selected Major World Stock Market Indexes1 Country and Index    2008 range2    High          Low Year end close Percent change from 12/31/2007 Argentina, Merval 2249 829 1080 −50 Australia, Sydney All Ordinaries 6434 3333 3659 −43 Brazil …   Universalium

  • Economic Affairs — ▪ 2006 Introduction In 2005 rising U.S. deficits, tight monetary policies, and higher oil prices triggered by hurricane damage in the Gulf of Mexico were moderating influences on the world economy and on U.S. stock markets, but some other… …   Universalium

  • Business Overview — ▪ 2009 Introduction Automobiles.       The American automotive industry began 2008 in precarious condition, and as the year unfolded, the situation went from bad to worse. First, gasoline prices of $3.50 to $4 per gallon throughout much of the… …   Universalium

Share the article and excerpts

Direct link
Do a right-click on the link above
and select “Copy Link”