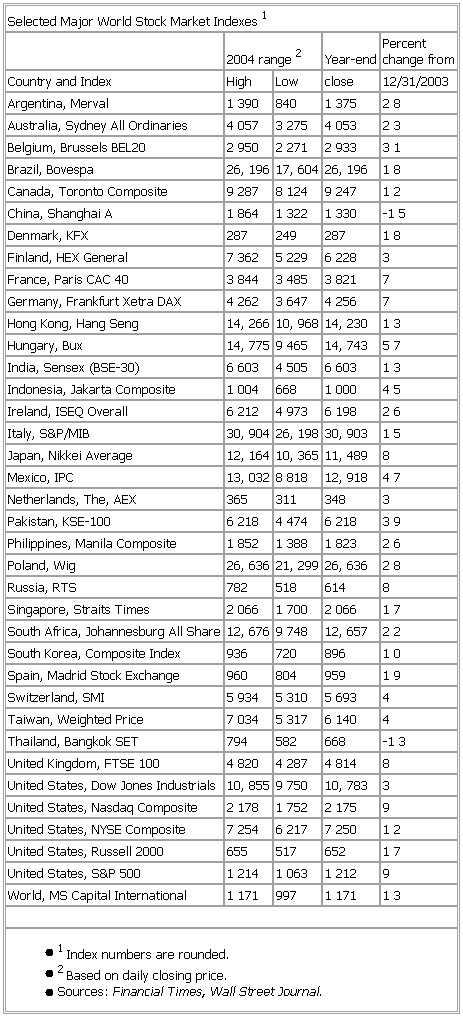
- Selected Major World Stock Market Indexes
-
▪ TableSelected Major World Stock Market Indexes12004 range2 Year-end Percentchange fromCountry and Index High Low close 12/31/2003Argentina, Merval 1390 840 1375 28Australia, Sydney All Ordinaries 4057 3275 4053 23Belgium, Brussels BEL20 2950 2271 2933 31Brazil, Bovespa 26,196 17,604 26,196 18Canada, Toronto Composite 9287 8124 9247 12China, Shanghai A 1864 1322 1330 -15Denmark, KFX 287 249 287 18Finland, HEX General 7362 5229 6228 3France, Paris CAC 40 3844 3485 3821 7Germany, Frankfurt Xetra DAX 4262 3647 4256 7Hong Kong, Hang Seng 14,266 10,968 14,230 13Hungary, Bux 14,775 9465 14,743 57India, Sensex (BSE-30) 6603 4505 6603 13Indonesia, Jakarta Composite 1004 668 1000 45Ireland, ISEQ Overall 6212 4973 6198 26Italy, S&P/MIB 30,904 26,198 30,903 15Japan, Nikkei Average 12,164 10,365 11,489 8Mexico, IPC 13,032 8818 12,918 47Netherlands, The, AEX 365 311 348 3Pakistan, KSE-100 6218 4474 6218 39Philippines, Manila Composite 1852 1388 1823 26Poland, Wig 26,636 21,299 26,636 28Russia, RTS 782 518 614 8Singapore, Straits Times 2066 1700 2066 17South Africa, Johannesburg All Share 12,676 9748 12,657 22South Korea, Composite Index 936 720 896 10Spain, Madrid Stock Exchange 960 804 959 19Switzerland, SMI 5934 5310 5693 4Taiwan, Weighted Price 7034 5317 6140 4Thailand, Bangkok SET 794 582 668 -13United Kingdom, FTSE 100 4820 4287 4814 8United States, Dow Jones Industrials 10,855 9750 10,783 3United States, Nasdaq Composite 2178 1752 2175 9United States, NYSE Composite 7254 6217 7250 12United States, Russell 2000 655 517 652 17United States, S&P 500 1214 1063 1212 9World, MS Capital International 1171 997 1171 13● 1Index numbers are rounded.● 2Based on daily closing price.See as table:

* * *
Universalium. 2010.
