- Selected U.S. Stock Market Indexes, Table
-
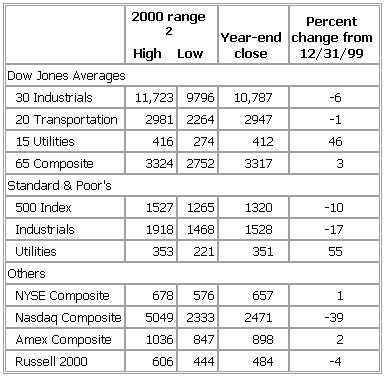
▪ 2001Table VI. Selected U.S.Stock Market Indexes12000 range2change from12/31/99Dow Jones Averages30 Industrials 11,723 9796 10,787 -620 Transportation 2981 2264 2947 -115 Utilities 416 274 412 4665 Composite 3324 2752 3317 3Standard & Poor's500 Index 1527 1265 1320 -10Industrials 1918 1468 1528 -17Utilities 353 221 351 55OthersNYSE Composite 678 576 657 1Nasdaq Composite 5049 2333 2471 -39Amex Composite 1036 847 898 2Russell 2000 606 444 484 -4See as table:
 1Index numbers are rounded.2Based on daily closing price.▪ 2000Table VI. Selected U.S. Stock Market Indexes11999 range2change from12/31/98Dow Jones Averages30 Industrials 11,497 9121 11,497 2520 Transportation 3784 2808 2977 -515 Utilities 333 269 283 -965 Composite 3366 2832 3214 12Standard & Poor's500 Index 1469 1212 1469 20Industrials 1842 1462 1842 25Utilities 270 216 227 -13OthersNYSE Composite 663 576 650 9Nasdaq Composite 4069 2208 4069 86Amex Composite 877 684 877 27Russell 2000 505 383 505 20See as table:
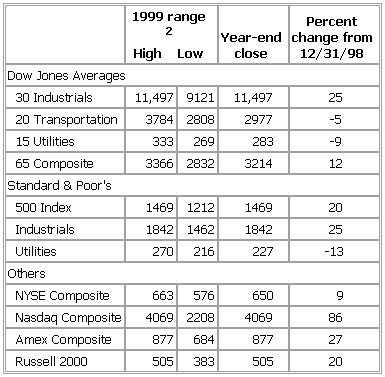 1Index numbers are rounded.2Based on daily closing price.▪ 1999Table VII. Selected U.S. Stock Market Indexes11998 range2change from12/31/97Dow Jones averages30 industrials 9374 7539 9181 1620 transportation 3686 2345 3149 -315 utilities 321 263 312 1465 composite 2961 2411 2871 10Standard & Poor's500 index 1242 928 1229 27Industrials 1494 1077 1479 32Utilities 267 226 260 10OthersNYSE composite 601 477 596 17Nasdaq composite 2193 1419 2193 40Amex composite 754 564 689 1Russell 2000 491 310 422 -3See as table:
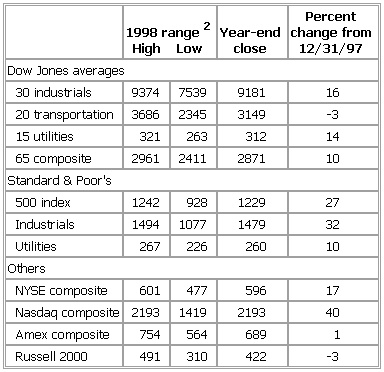 1Index numbers are rounded.2Based on daily closing price.
* * *
Universalium. 2010.