- Index Numbers of Production, Employment, and Productivity in Manufacturing Industries, Table
-
▪ 1999Table IV. Index Numbers of Production, Employment, and Productivity1 in Manufacturing Industries1990 = 100Area 1996 1997 1996 1997 1996 1997World2 113 120 . . . . . . . . . . . .Developed countries 108 115 . . . . . . . . . . . .Less-developed countries 133 140 . . . . . . . . . . . .North America3 121 132 . . . . . . . . . . . .Canada 112 119 93 96 121 124United States 118 127 97 98 122 130Latin America4 115 118 . . . . . . . . . . . .Brazil 112 116 . . . . . . . . . . . .Mexico 117 127 . . . . . . . . . . . .Asia5 113 118 . . . . . . . . . . . .India 146 151 . . . . . . . . . . . .Japan 97 101 100 100 97 101South Korea 161 172 96 92 167 186Europe6 94 97 . . . . . . . . . . . .Austria 115 123 . . . . . . . . . . . .Belgium 107 112 . . . . . . . . . . . .Denmark 117 123 . . . . . . . . . . . .Finland 121 133 82 83 147 160France 98 102 . . . . . . . . . . . .Germany (1991 = 100) 96 100 . . . . . . . . . . . .Greece 98 99 . . . . . . . . . . . .Ireland 176 205 116 . . . 151 . . .Netherlands, The 109 114 . . . . . . . . . . . .Norway 115 118 . . . . . . . . . . . .Portugal 97 102 . . . . . . . . . . . .Sweden 121 130 . . . . . . . . . . . .Switzerland 103 109 . . . . . . . . . . . .United Kingdom 103 104 . . . . . . . . . . . .Rest of the world7 . . . . . . . . . . . . . . . . . .Oceania 109 110 . . . . . . . . . . . .South Africa 103 106 96 . . . 105 . . .See as table:
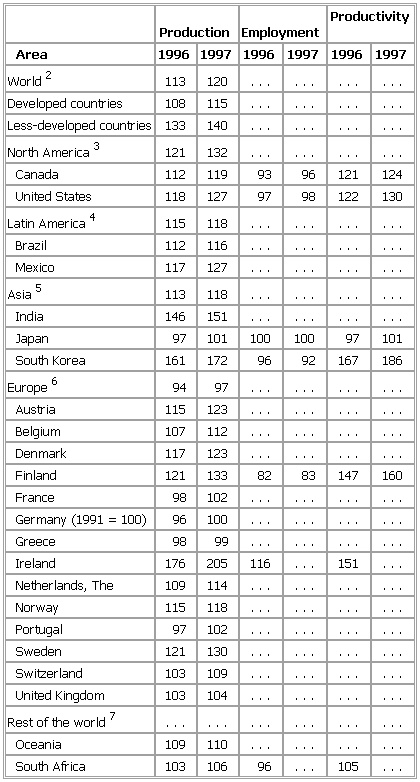 1This is 100 times the production index divided by the employmentindex, giving a rough indication of changes in output per personemployed.2Excluding China and former U.S.S.R.3Canada and the United States.4South and Central America (including Mexico) and theCaribbean islands.5Asian Middle East and East and Southeast Asia, including Japan,Israel, and Turkey.6Excluding Albania, former Czechoslovakia, former Yugoslavia,and European countries of the former Soviet Union.7Africa and Oceania.Sources: UN, Monthly Bulletin of Statistics; ILO, Yearbook ofLabour Statistics.
* * *
▪ Table1980 = 100Relativeimportance{1} Production Employment Productivity{2}Area 1980 1992 1991 1992 1991 1992 1991 1992World{3} 1,000 1,000 131 131 . . . . . . . . . . . .Industrial countries 861 785 122 120 . . . . . . . . . . . .Less industrializedcountries 139 215 188 209 . . . . . . . . . . . .North America{4} 282 279 128 130 . . . . . . . . . . . .Canada 22 19 111 111 . . . . . . . . . . . .United States 260 260 136 139 92 90 148 154Latin America{5} 79 116 166 193 . . . . . . . . . . . .Brazil 26 18 97 93 . . . . . . . . . . . .Mexico 18 18 129 132 . . . . . . . . . . . .Asia{6} 183 239 175 172 . . . . . . . . . . . .India 11 . . . 204 . . . . . . . . . . . . . . .Japan 131 141 150 141 120 122 125 116South Korea 6 16 342 360 . . . . . . . . . . . .Europe{7} 422 347 111 108 . . . . . . . . . . . .Austria 9 9 137 138 86 . . . 159 . . .Belgium 13 12 123 119 . . . . . . . . . . . .Denmark 5 5 135 138 99 97 136 142Finland 6 5 117 120 79 71 148 169France 75 62 108 108 . . . . . . . . . . . .Former WestGermany 114 109 128 125 . . . . . . . . . . . .Greece 4 3 102 101 . . . . . . . . . . . .Ireland 2 3 202 222 85 . . . 238 . . .Netherlands, The 14 14 126 128 . . . . . . . . . . . .Norway 5 4 109 111 . . . . . . . . . . . .Portugal 3 3 147 141 . . . . . . . . . . . .Spain 23 . . . 118 . . . . . . . . . . . . . . .Sweden 13 11 112 108 80 . . . 134 . . .Switzerland 13 12 124 123 . . . . . . . . . . . .United Kingdom 58 51 116 116 . . . . . . . . . . . .Rest of the world{8} 34 30 . . . . . . . . . . . . . . . . . .Oceania 15 13 109 110 . . . . . . . . . . . .South Africa 8 6 103 100 . . . . . . . . . . . .{1}The 1980 weights are those applied by the UN Statistical Office.{2}This is 100 times the production index divided by the employment index, giving a rough indication of changes in output per person employed.{3}Excluding Albania, China, North Korea, Vietnam, Czechoslovakia, former Soviet Union, and former Yugoslavia.{4}Canada and the United States.{5}South and Central America (including Mexico) and the Caribbean islands.{6}Asian Middle East and East and Southeast Asia, including Japan, Israel, and Turkey.{7}Excluding Albania, former Czechoslovakia, former Yugoslavia, and European countries of the former Soviet Union.{8}Africa and Oceania.Source: UN,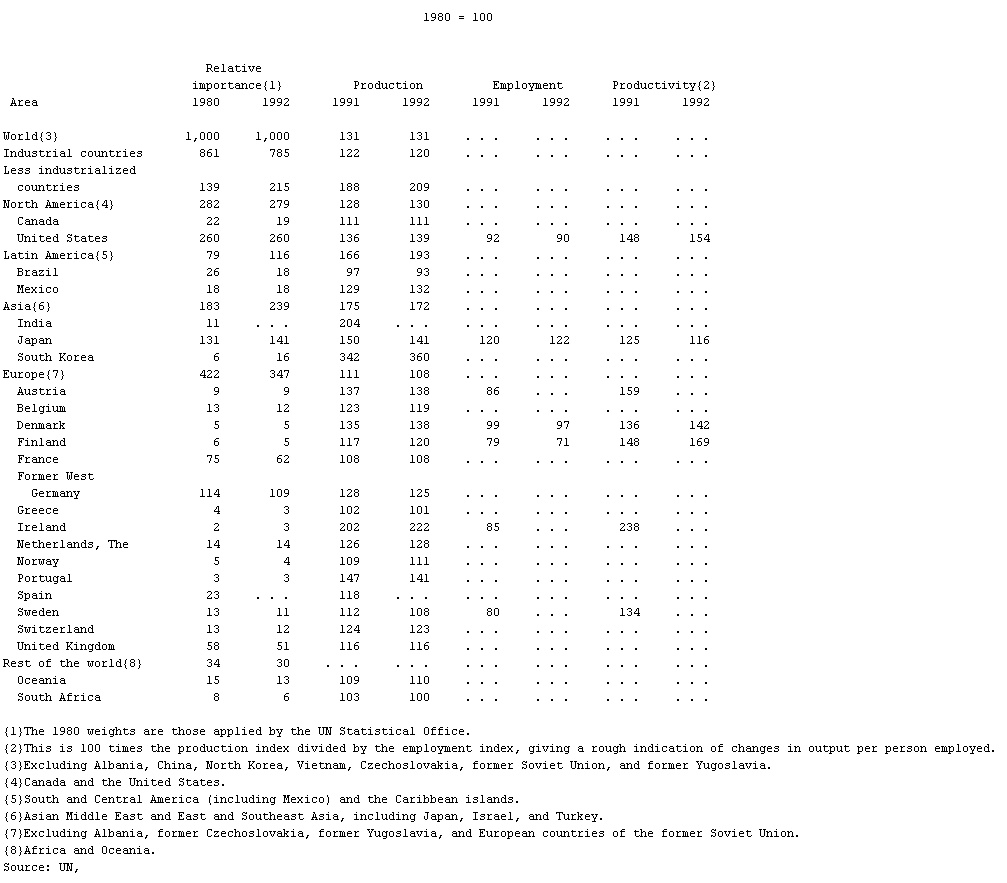 Monthly Bulletin of Statistics.
 * * *
Universalium. 2010.