- Changes in Output in Less-Developed Countries, Table
-
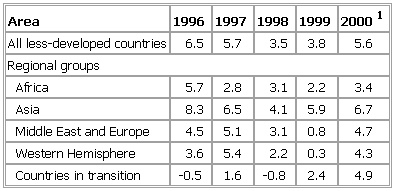
▪ 2001Table III. Changes in Outputin Less-Developed Countries% annual change in real gross domestic productAll less-developed countries 6.5 5.7 3.5 3.8 5.6Regional groupsAfrica 5.7 2.8 3.1 2.2 3.4Asia 8.3 6.5 4.1 5.9 6.7Middle East and Europe 4.5 5.1 3.1 0.8 4.7Western Hemisphere 3.6 5.4 2.2 0.3 4.3Countries in transition -0.5 1.6 -0.8 2.4 4.9See as table:
 1Projected.October 2000.▪ 2000Table III. Changes in Output in Less-Developed Countries% annual change in real gross domestic productAll less-developed countries 6.1 6.6 5.8 3.2 3.5Regional groupsAfrica 3.0 5.9 3.1 3.4 3.1Asia 9.0 8.2 6.6 3.7 5.3Middle East and Europe 3.7 4.7 4.5 3.2 1.8Western Hemisphere 1.5 3.6 5.3 2.2 0.1Countries in transition -0.5 -0.3 2.2 -0.2 0.8See as table:
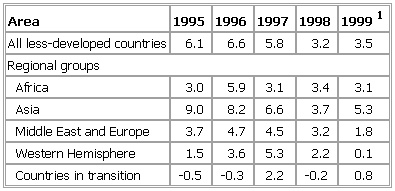 1Projected.October 1999.▪ 1999Table IV. Changes in Output in Less-Developed Countries% annual change in real gross domestic productAll less-developed countries 6.7 6.1 6.6 5.8 2.3Regional groupsAfrica 2.2 3.1 5.8 3.2 3.7Asia 9.6 9.0 8.2 6.6 1.8Middle East and Europe 0.7 3.8 4.7 4.7 2.3Western Hemisphere 5.2 1.2 3.5 5.1 2.8Countries in transition -7.1 -1.5 -1.0 -2.0 -0.2See as table:
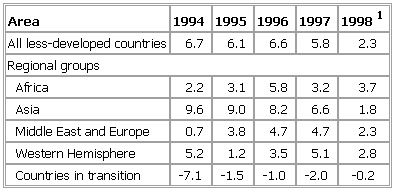 1Projected.October 1998.
* * *
▪ TableTable IV. Changes in Output in Less-Developed Countries% annual change in real gross domestic productAll less-developed countries 6.3 6.6 6.0 6.5 6.2Africa 0.9 2.9 2.8 5.2 3.7Asia 8.7 9.1 8.9 8.2 7.5Middle East and Europe 4.2 0.5 3.5 4.8 4.6Western Hemisphere 3.2 4.7 1.3 3.4 4.1See as table: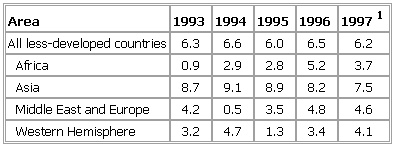 1Projected.October 1997.
* * *
Universalium. 2010.