- Changes in Consumer Prices in Less-Developed Countries, Table
-
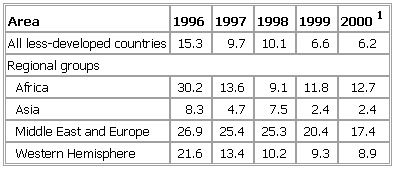
▪ 2001Table IV. Changes in ConsumerPrices in Less-DevelopedCountries% change from preceding yearAll less-developed countries 15.3 9.7 10.1 6.6 6.2Regional groupsAfrica 30.2 13.6 9.1 11.8 12.7Asia 8.3 4.7 7.5 2.4 2.4Middle East and Europe 26.9 25.4 25.3 20.4 17.4Western Hemisphere 21.6 13.4 10.2 9.3 8.9See as table:
 1Projected.October 2000.▪ 2000Table IV. Changes in Consumer Prices in Less-Developed Countries% change from preceding yearAll less-developed countries 22.3 14.1 9.2 10.3 6.7Regional groupsAfrica 34.1 26.7 11.1 8.7 9.0Asia 12.8 7.9 4.8 8.0 3.1Middle East and Europe 35.9 24.6 23.1 23.6 18.3Western Hemisphere 35.9 20.8 13.2 10.6 9.8See as table:
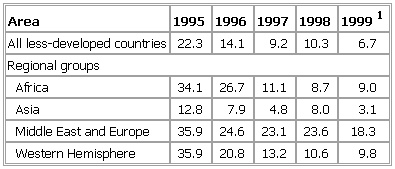 1Projected.December 1999.▪ 1999% change from preceding yearAll less-developed countries 51.6 22.3 14.1 9.1 10.3Regional groupsAfrica 37.5 34.1 26.7 11.0 7.7Asia 15.0 12.8 7.9 4.7 8.3Middle East and Europe 31.9 35.9 24.6 22.6 22.6Western Hemisphere 208.3 35.9 20.8 13.9 10.8See as table:
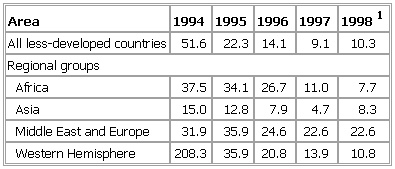 1Projected.October 1998.
* * *
▪ Table% change from preceding yearAll less-developed countries 35.7 42.7 46.8 19.8 13.3Africa 31.7 29.5 36.8 32.1 21.3Asia 6.9 9.6 13.4 10.9 7.9Middle East and Europe 25.9 24.0 31.5 32.5 25.6Western Hemisphere 151.5 209.5 210.9 35.6 20.4See as table: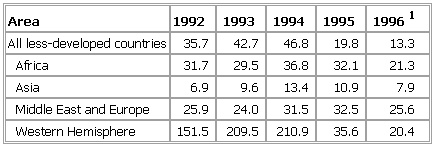 1Estimated.
* * *
Universalium. 2010.